DevSecOps Homelab Part 2: Building the Pipeline
Welcome to the second part of our three-part series, where I continue to explore DevSecOps concepts in my homelab and bring you along for the ride. In the last article, I discussed about my motivations for starting this project. Now, let's get practical and hands-on.
Note: I am using a self-hosted Gitea instance to host the project's repository, store the container images, and manage and execute the CI/CD pipeline.
Tools of Trade
Before dive into the nitty-gritty of building and implementing a functional CI/CD pipeline, I'll introduce the tools I'll be employing in this project, which are:
- Pygoat: An intentionally vulnerable application, ripe for testing with our security tools.
- Bandit: A static code analysis tool, used for scanning Python source code in a "static" state to identify vulnerabilities.
- ZAP: A dynamic analysis tool, used for scanning code during execution to identify vulnerabilities.
- DependencyCheck: A software composition analysis tool, used for scanning for vulnerabilities in our app's dependencies.
- Trufflehog: A secrets scanning tool, used for scanning the source code for any hard-coded passwords or secrets.
- Trivy: A container security scanning tool, used for scanning containers or images for known vulnerabilities, malwares, and other potential threats.
Step-by-step Pipeline Workflow

The image above showcases a very simple diagram illustrating the workflow of the CI/CD pipeline. Essentially, the entire pipeline is triggered by pushing a commit into the Gitea instance. From there, several security scans are performed before proceeding to deploy the application across various environments.
Step 1: Creating the Workflow YAML
By default, Gitea uses Gitea Actions as its built-in CI/CD solution. Gitea Actions is similar and designed to be compatible with GitHub Actions, which means it also uses the same syntax.
So, as our first step, we need to create a workflow file named devsecops.yaml in the .gitea/workflows directory, adding the following content:
name: DevSecOps CI/CD Pipeline
run-name: DevSecOps CI/CD Pipeline
on: [push]

jobs:
  build-scan-deploy:
    runs-on: ubuntu-latest
    steps:
      - name: Checkout
        uses: actions/checkout@v4

      - name: Setup Python 3.8
        uses: actions/setup-python@v4
        with:
          python-version: "3.8.18"
        env:
          AGENT_TOOLSDIRECTORY: /opt/hostedtoolcache

      - name: Setup JDK 1.8
        uses: actions/setup-java@v4
        with:
          distribution: "zulu"
          java-version: "8"

      - name: Build and Install Dependencies
        run: |
          python -m pip install --upgrade pip
This configuration instructs the pipeline to activate upon receiving a push event, and defines a single CI/CD job named build-scan-deploy, which executes on the ubuntu-latest runner.
Note: For the purpose of this demo, we will use push event as the trigger for our pipeline. However, in real-world scenarios, you will need to adjust this according to your specific needs.Additionally, we defined the initial four steps for this CI/CD job – first, we checkout the source code, then configure Python and JDK, which are pre-requisites by some of the security tools we will be using, and finally we install our pip dependency.
Step 2: Setting up Bandit for Static Code Analysis
For our next step, we will install Bandit via pip and execute it to perform static code analysis on our Python source code, we will also configure it to export the results in JSON format.
      ...
      - name: Static Code Analysis using Bandit
        run: |
          pip install bandit
          bandit -r . -f json -o sast-${{ github.sha }}.reports.json
        continue-on-error: true # only for testing. remove on prod.
Step 3: Setting up OWASP DependencyCheck for Software Composition Analysis
Moving forward, we will use OWASP DependencyCheck to detect vulnerabilities in third-party dependencies. Initially, we will download its latest version, then execute it. Additionally, we'll provide our NVD API Key since DependencyCheck now relies on NVD API. Furthermore, we'll activate the --enableExperimental flag, considering that the Python analyzer remains "experimental". Lastly, we'll export the results in XML format.
      ...
      - name: Download OWASP DependencyCheck
        run: |
          VERSION=$(curl -s https://jeremylong.github.io/DependencyCheck/current.txt)
          curl -sL "https://github.com/jeremylong/DependencyCheck/releases/download/v$VERSION/dependency-check-$VERSION-release.zip" --output dependency-check.zip
          unzip dependency-check.zip

      - name: Software Composition Analysis using DependencyCheck
        run: |
          ./dependency-check/bin/dependency-check.sh \
          --project ${{ github.repository }} \
          --scan . \
          --format "XML" \
          --out sca-${{ github.sha }}.reports.xml \
          --nvdApiKey ${{ secrets.NVD_API_KEY }} \
          --enableExperimental
        continue-on-error: true # only for testing. remove on prod.
Step 4: Setting up Trufflehog for Secrets Scanning
Following that, we'll utilize Trufflehog to scan our source code for any leaked credentials and secrets. First, we'll install Trufflehog binary, then execute it to start the scan, and configure it to export the results in JSON format.
      ...
      - name: Secrets Scanning using Trufflehog
        run: |
          curl -sSfL https://raw.githubusercontent.com/trufflesecurity/trufflehog/main/scripts/install.sh | sh -s -- -b /usr/local/bin
          trufflehog filesystem . --fail --json | jq -c '.SourceMetadata' > secrets-${{ github.sha }}.reports.json
        continue-on-error: true # only for testing. remove on prod.
Step 5: Build and Scan Docker Image using Trivy
Once we're done with our initial scans, it's time to build our Docker image. We will then use Trivy to scan for vulnerabilities in the Docker image. Initially, we will install the Trivy binary, then execute it to start the scan, and finally export the results in JSON format.
      ...
      - name: Build Docker image
        run: |
          docker build -f Dockerfile -t seclab/pygoat:latest .

      - name: Container Scanning using Trivy
        run: |
          curl -sfL https://raw.githubusercontent.com/aquasecurity/trivy/main/contrib/install.sh | sh -s -- -b /usr/local/bin v0.50.4
          trivy image -f json -o container-${{ github.sha }}.reports.json seclab/pygoat:latest
        continue-on-error: true # only for testing. remove on prod.
Step 6: Deploy Image as Container and Setup ZAP for Dynamic Code Analysis
At last, we'll proceed to deploy the Docker image as a container, allowing us to conduct vulnerability scans during the application's runtime. We will be using ZAP to perform this scan. Initially, we'll deploy ZAP's dockerized version and specify the local IP address of our deployed application. Additionally, we'll export the scan results in JSON format.
      ...
      - name: Deploy Docker image as container
        run: |
          docker run -d -p 8000:8000 --name=seclab-pygoat --restart=always seclab/pygoat:latest
        continue-on-error: true # only for testing. remove on prod.

      - name: Dynamic Code Analysis using ZAP
        run: |
          docker run --user $(id -u):$(id -g) --volume $(pwd):/zap/wrk/:rw --rm \
            -t ghcr.io/zaproxy/zaproxy:stable zap-baseline.py \
            -t http://172.16.30.11:8000 -J dast-${{ github.sha }}.reports.json
        continue-on-error: true # only for testing. remove on prod
Note: We only performed a "baseline" scan for the purpose of this demo. In real-world scenarios, it's advisable to conduct comprehensive scans regularly, rather than only when the designated events are triggered, in order to optimize the pipeline's execution time.
Step 7: Results
If you followed everything correctly, your devsecops.yaml should be resemble the following:

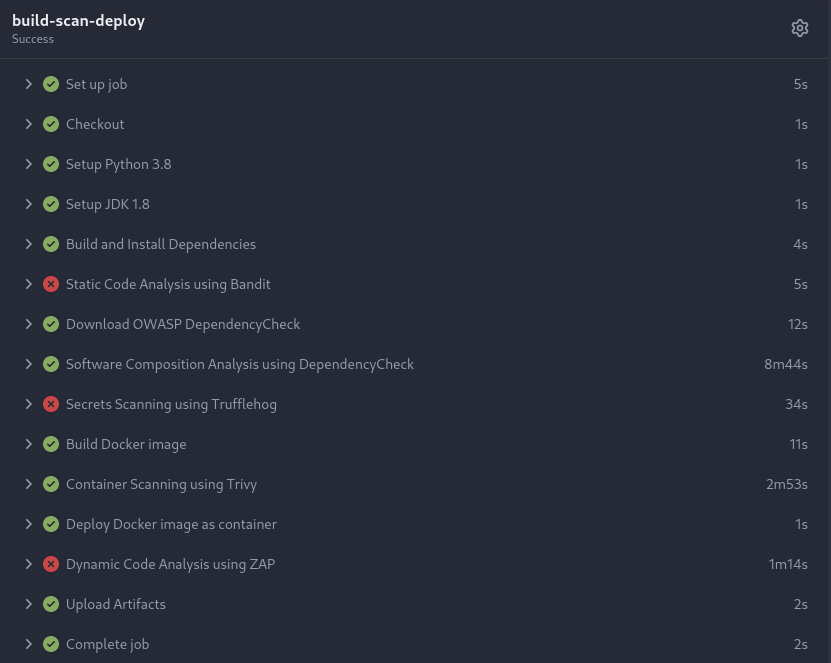
Moreover, once the pipeline is triggered, you can track its progress under the "Actions" tab within the repository. It should display something similar to the following:

What comes next?
Now that we have a working CI/CD pipeline, our focus shifts to addressing the findings from our security tools. To tackle this, we'll turn to Application Security Posture Management Platforms (ASPM), which we'll explore in detail in the upcoming and final article of this series. Stay tuned—you won't want to miss it!